Cornichon is a powerful tool you can use to dynamically profile Mac OS X applications on the system and track the process’ performance over time.
Want to support this blog? Please check out
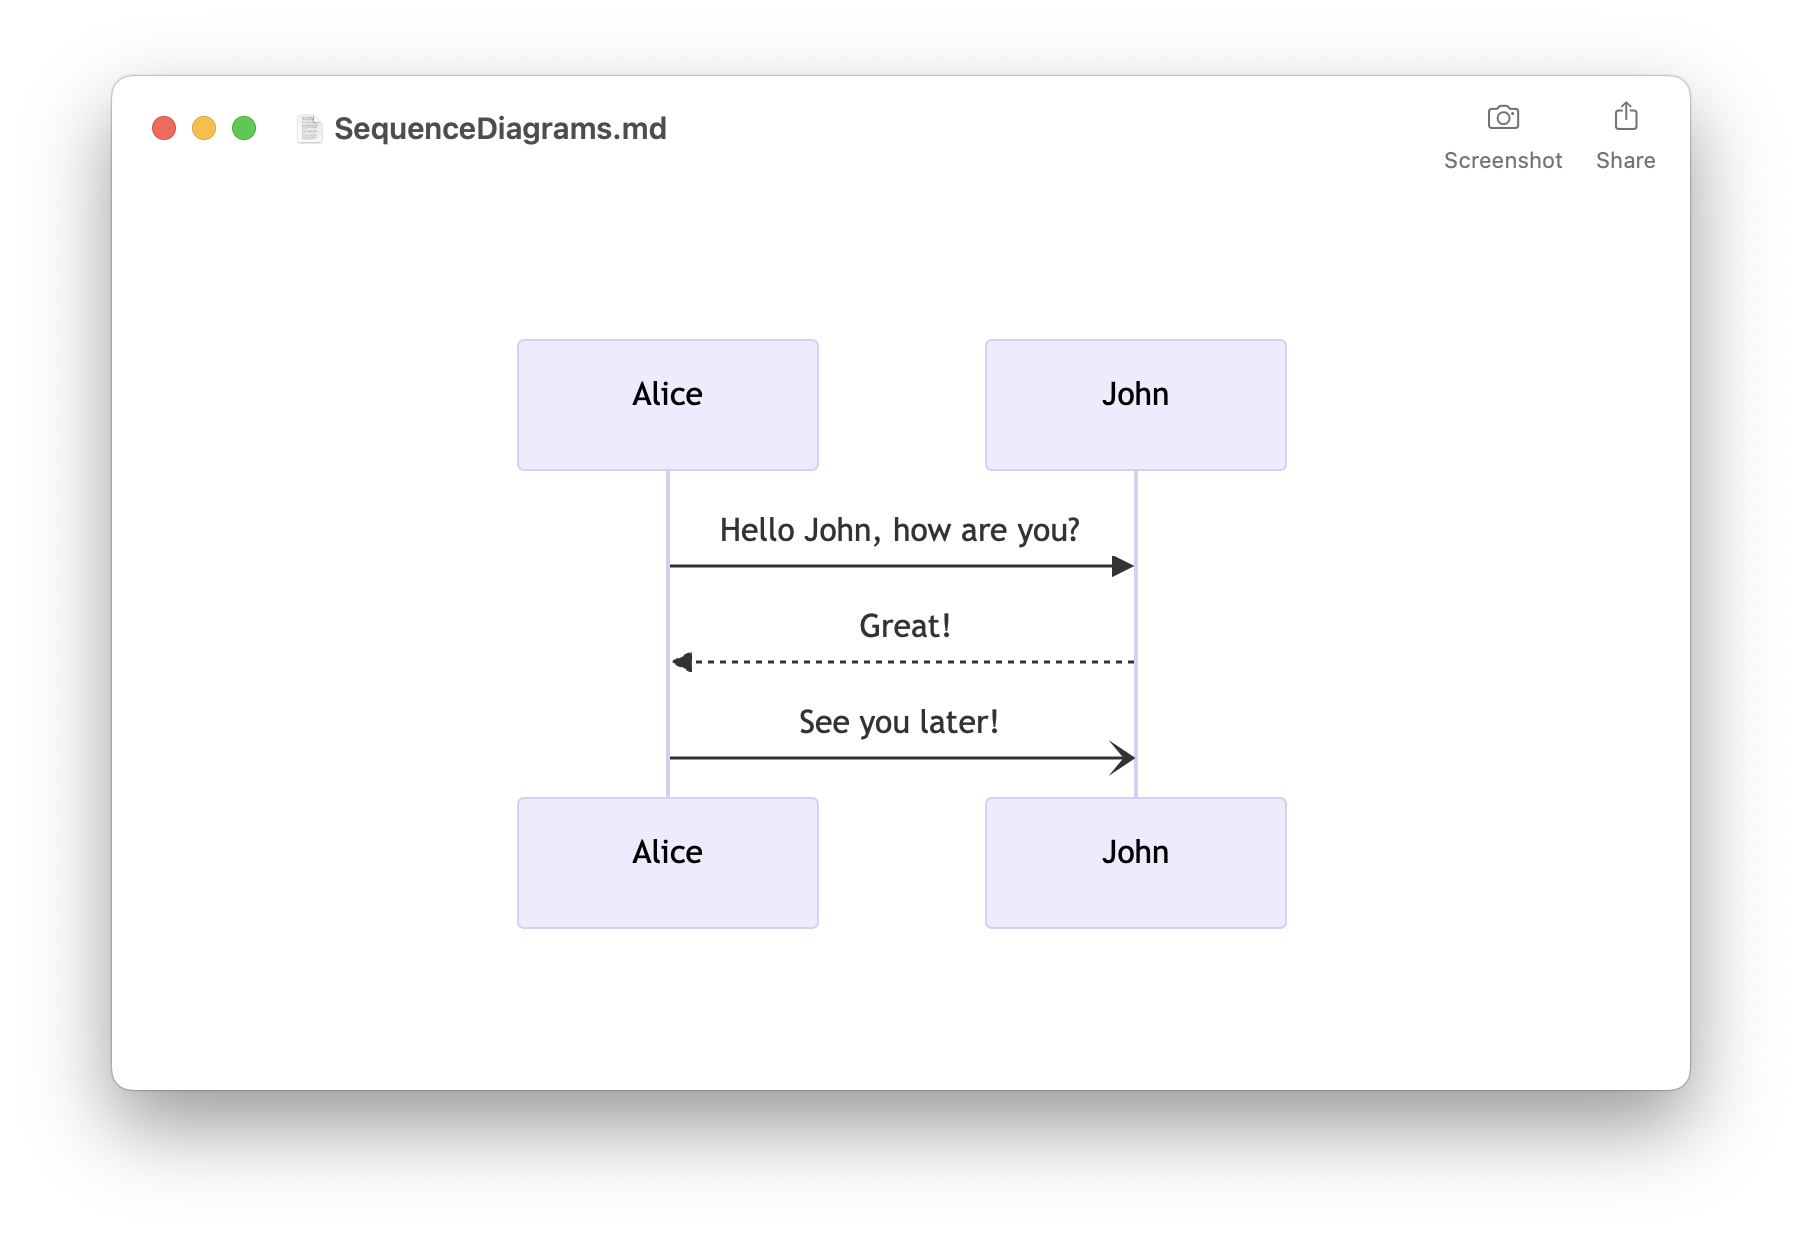

- Easily preview Mermaid diagrams
- Sequence diagrams, flowcharts, …
- Built-in editor
- Export to PDF, PNG, and SVG
- Quick Look integration
- Available on macOS, iOS, and iPadOS
- Free download on the App Store
| Free Download for Mac OS X | Buy now for 5 € |
Figure 1: Profiling Safari with Cornichon

The Cornichon application includes the ability to:
- Profile Mac OS X applications
- Profile iPhone applications running in the iPhone simulator
- Examine the behavior of one or more processes
- See the different collected data of a process in real time in a graph
- Export the data as TAB files that you can later easily import in Apple Numbers or Microsoft Excel
With the Cornichon application, you can inspect different aspects of a process’ behavior:
- CPU usage
- Resident memory size (RSIZE)
- Resident private address space size (RPRVT)
- Total memory size (VSIZE)
- Number of threads
- …
Why using Cornichon?
Apple provides several tools that allow you to profile Mac OS X applications: Activity Monitor, Instruments, and some command line tools like top or ps.
But none of these tools provide a real-time graph to profile a specific application:
- Activity Monitor has no graph view which makes it difficult to see how the process’ performance evolves over time.
- The ‘Activity Monitor’ template of Instruments only monitors the system workload but not the workload of a specific application.
Cornichon System Requirements
- Mac OS X 10.5.8 or later.
- Universal application (for both Intel and PowerPC-based Macs).
FAQ
- How to order: You may install and use Cornichon on a trial basis for a period of seven days. You can buy a single-user license for 5 euros.
- Do you offer site licenses or multi-user licenses: Yes. Please contact me at timac@timac.org for details.