Here are different solutions to display automatically a backtrace when entering a specific function in your application. As an example we will take the following program. It’s a really simple program: the main function calls the function function1 which prints a string.

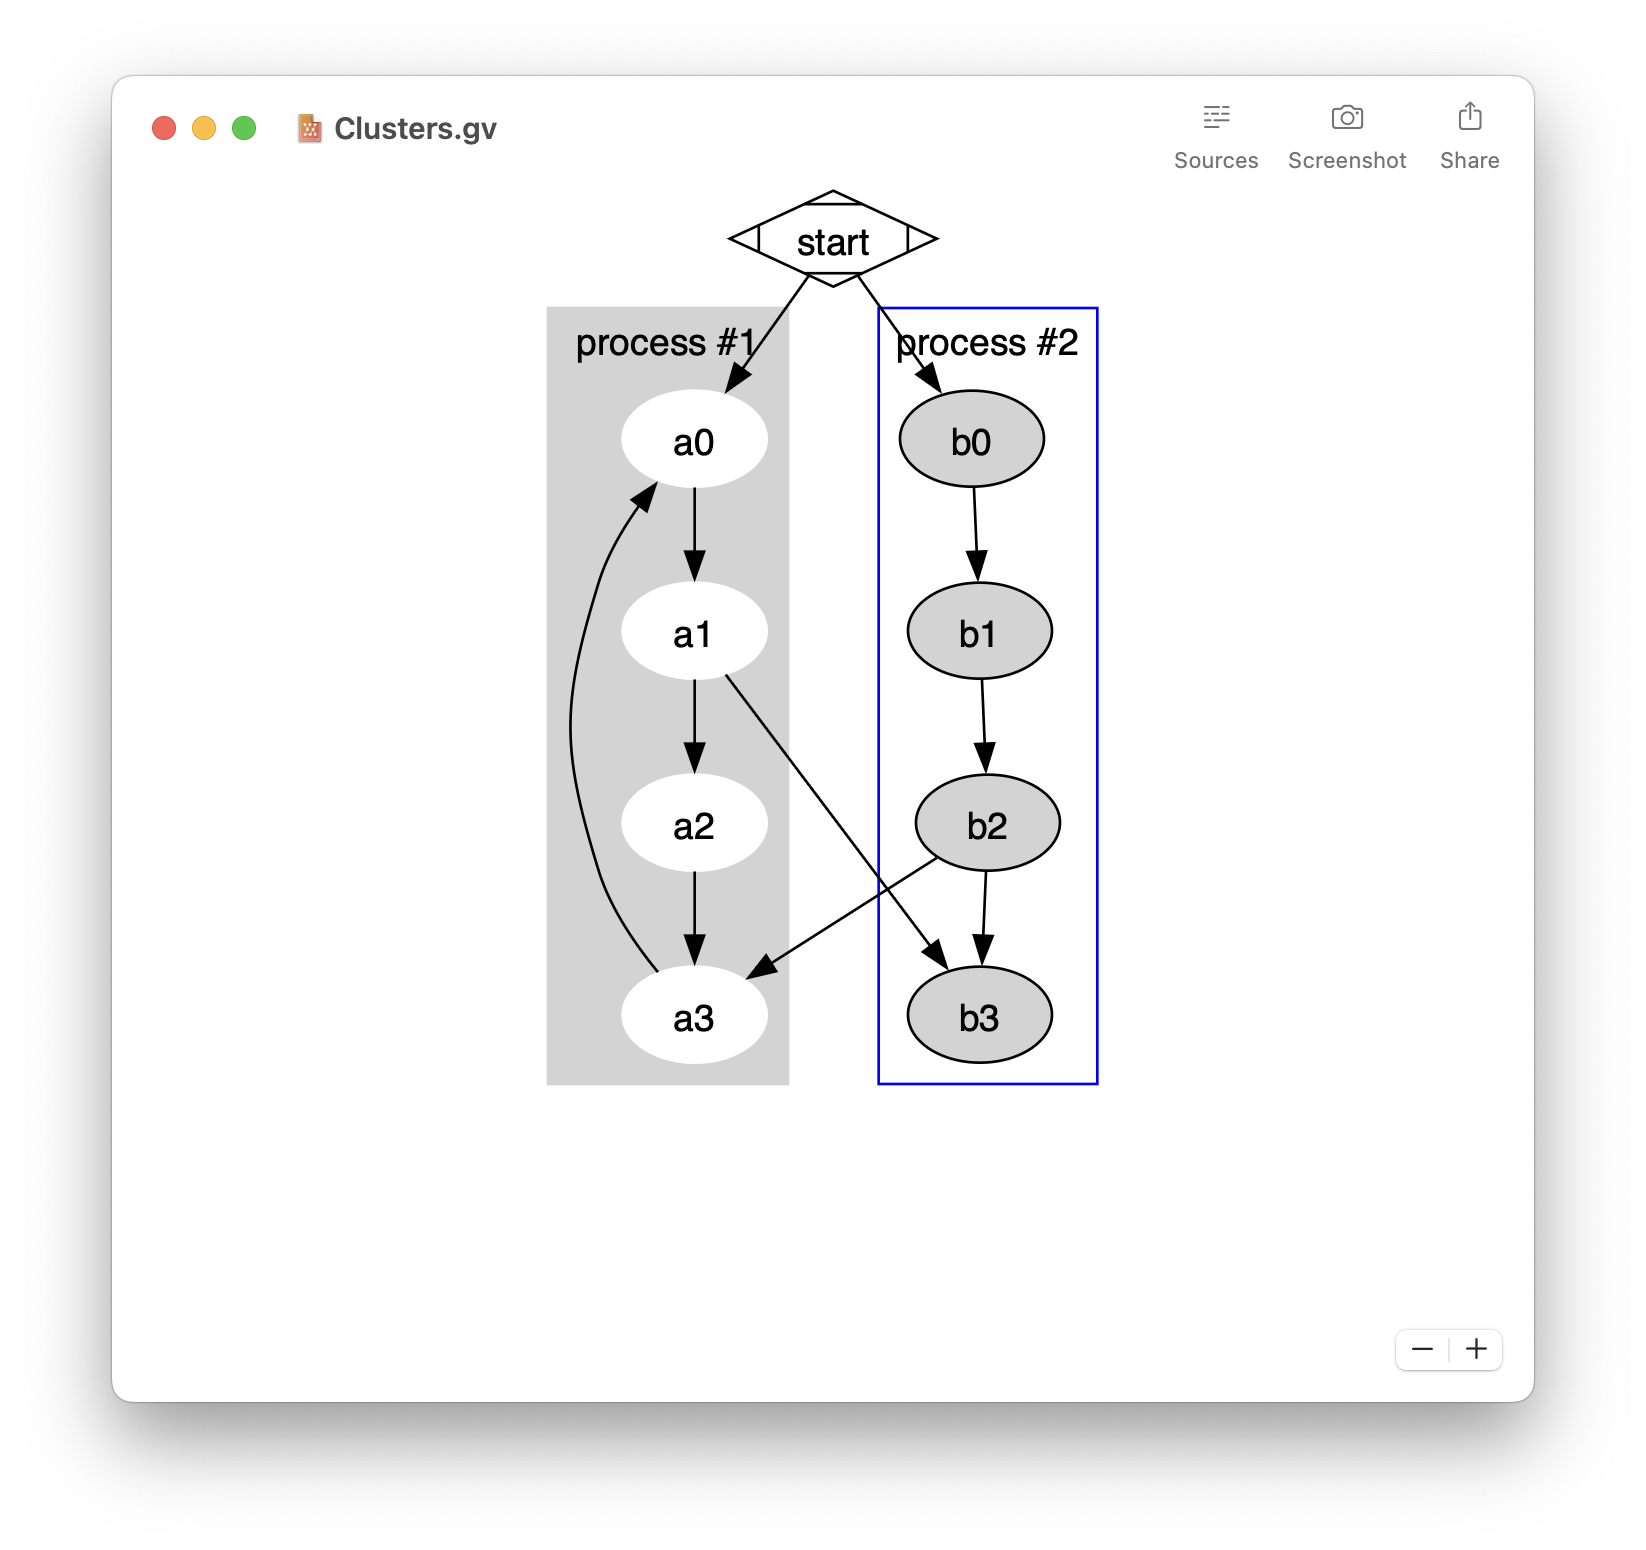
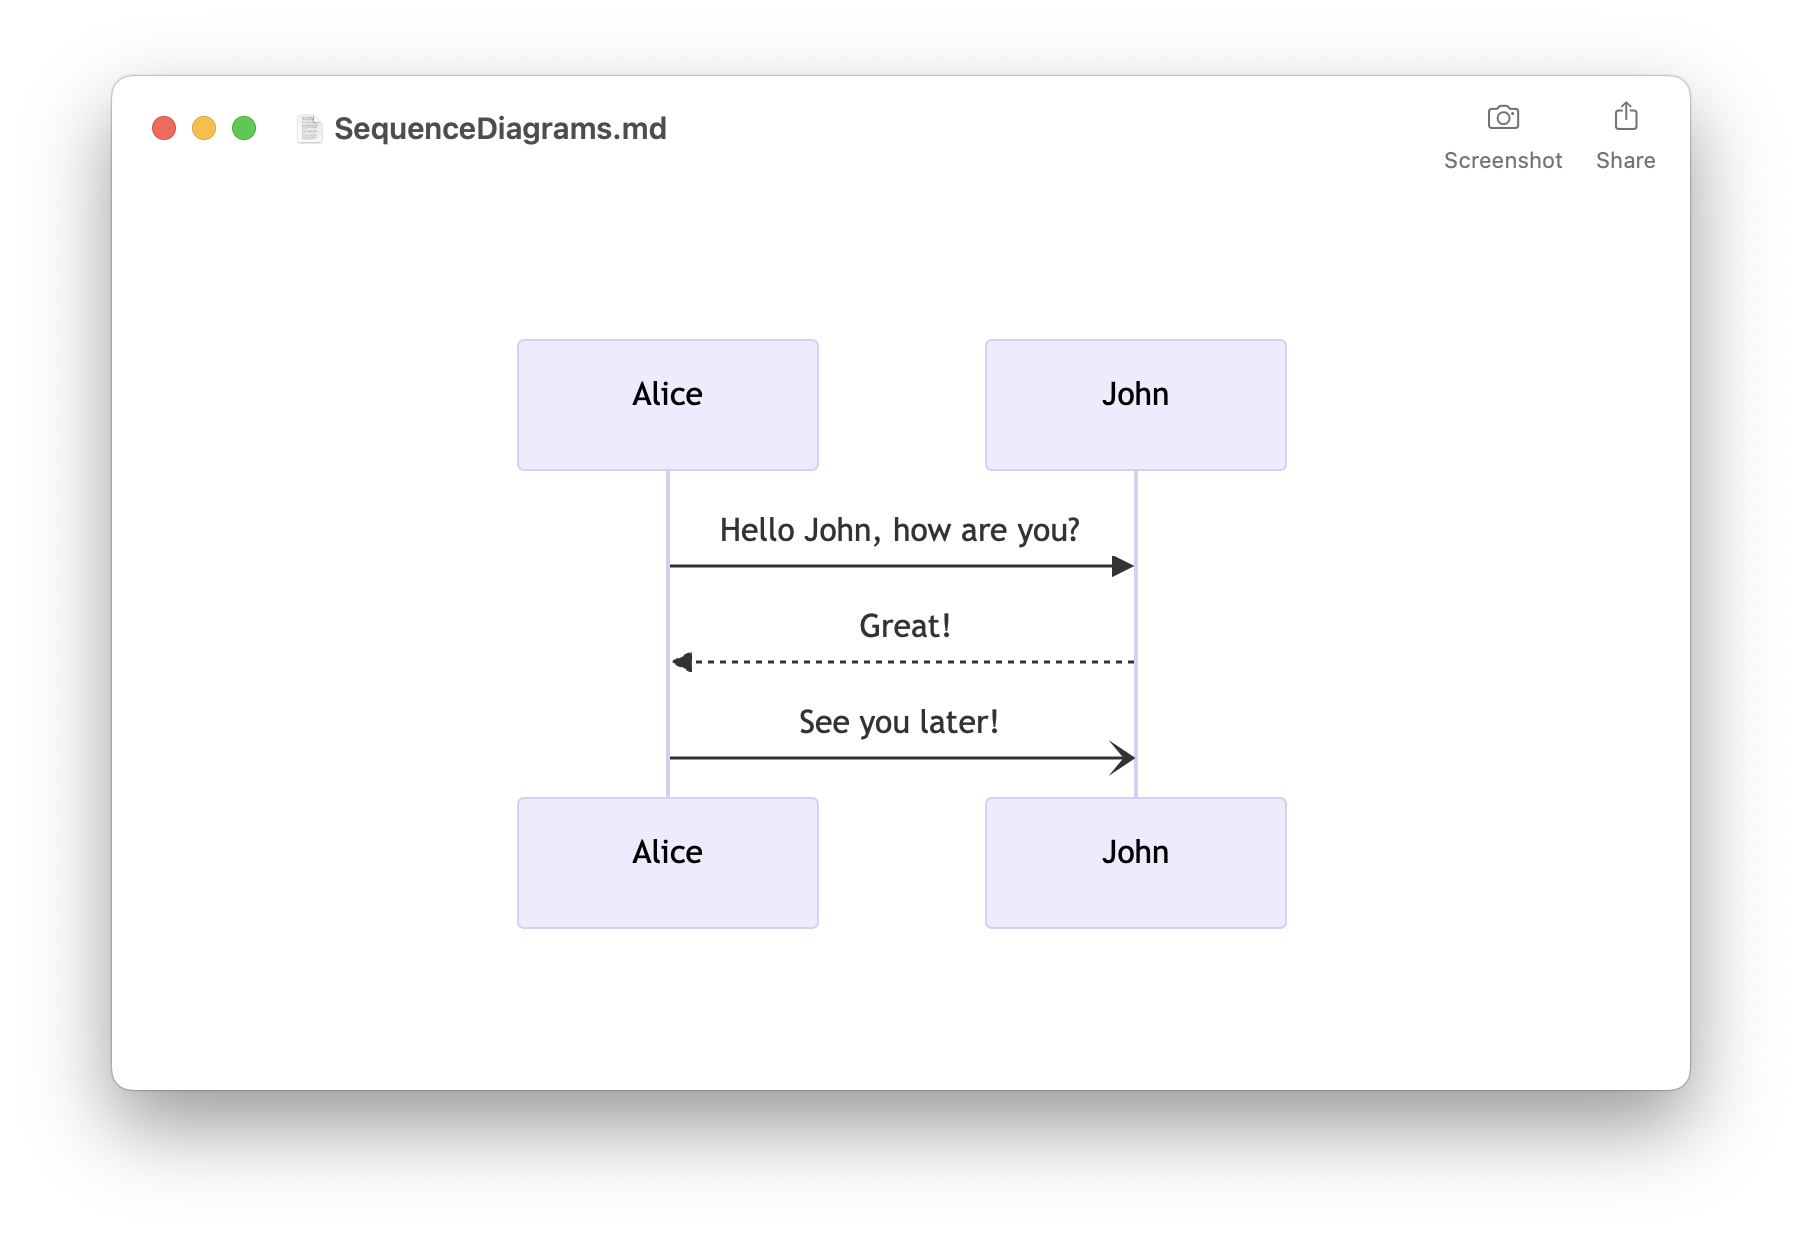
- Easily preview Mermaid diagrams
- Sequence diagrams, flowcharts, …
- Built-in editor
- Export to PDF, PNG, and SVG
- Quick Look integration
- Available on macOS, iOS, and iPadOS
- Free download on the App Store
#include <stdio.h>

void function1()
{
    fprintf(stderr, "Who called this function?\n");
}

int main()
{
    function1();
    return 0;
}
1- With GDB
The first solution is to set a breakpoint to the function “function1” and run your program in the debugger. Each time GDB breaks you can inspect the backtrace and see why your function is called.
You can extend this method and automatically dump a backtrace each time the function is called by creating a command on a breakpoint in GDB. You can indeed give any breakpoint a series of commands to execute when your program stops due to that breakpoint.
Following is a simple GDB script that can be loaded using the source command in GDB:
# We create a breakpoint using "future break"
# If we break due to this breakpoint, the command
#following will be executed.
fb function1
command
   backtrace
   continue
end
For such a script it is faster to manually type the script in GDB with some abbreviations (“c” for continue, “bt” for backtrace):
(gdb) fb function1
Breakpoint 1 at 0x100000eac
(gdb) command
Type commands for when breakpoint 1 is hit, one per line.
End with a line saying just “end”.
>bt
>c
>end
(gdb) r
Starting program: a.out
Reading symbols for shared libraries +. done

Breakpoint 1, 0x0000000100000eac in function1 ()
#0 0x0000000100000eac in function1 ()
#1 0x0000000100000edc in main ()
Who called this function?

Program exited normally.
(gdb)
2- Without GDB
The solution with GDB is powerful and requires no code change but it is slow (you need to run in the debugger). It is possible to display the backtraces without GDB by using the backtrace() and backtrace_symbols() functions available in 10.5 and later. Here is a sample code to show how to use these functions:
#include <execinfo.h>
#include <stdio.h>
#define BACKTRACE_MAX_DEPTH 20
static void dumpBacktrace()
{
void *stack_frame[BACKTRACE_MAX_DEPTH];
// backtrace() writes the function return addresses of the current
// call stack to the array of pointers referenced by array.
// At most, size pointers are written.
// The number of pointers actually written to array is returned.
int number_of_frames = backtrace(stack_frame, BACKTRACE_MAX_DEPTH);
// backtrace_symbols() attempts to transform a call stack obtained
// by backtrace() into an array of human readable strings using
// dladdr(). The array of strings returned has size elements.
// It is allocated using malloc() and should be released using free().
// There is no need to free the individual strings in the array.
char** human_readable_frames =
backtrace_symbols(stack_frame, number_of_frames);
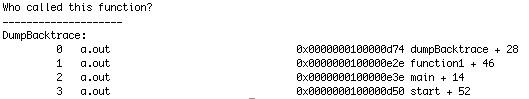
fprintf(stderr, "--------------------\nDumpBacktrace:\n");
int i = 0;
for (i = 0; i < number_of_frames; i++)
{
fprintf(stderr, "\t %s\n", human_readable_frames[i]);
}
// This needs to be released
free(human_readable_frames);
}
void function1()
{
fprintf(stderr, "Who called this function?\n");
dumpBacktrace();
}
int main()
{
function1();
return 0;
}
Here is the output: