You may want to stop into the debugger if something bad happened while executing your program. The easier way to do that is to have a breakpoint always set and to run your program in the debugger.
But sometimes you want to break even if there are no breakpoint. For example you know that something is wrong now and your program will crash later.

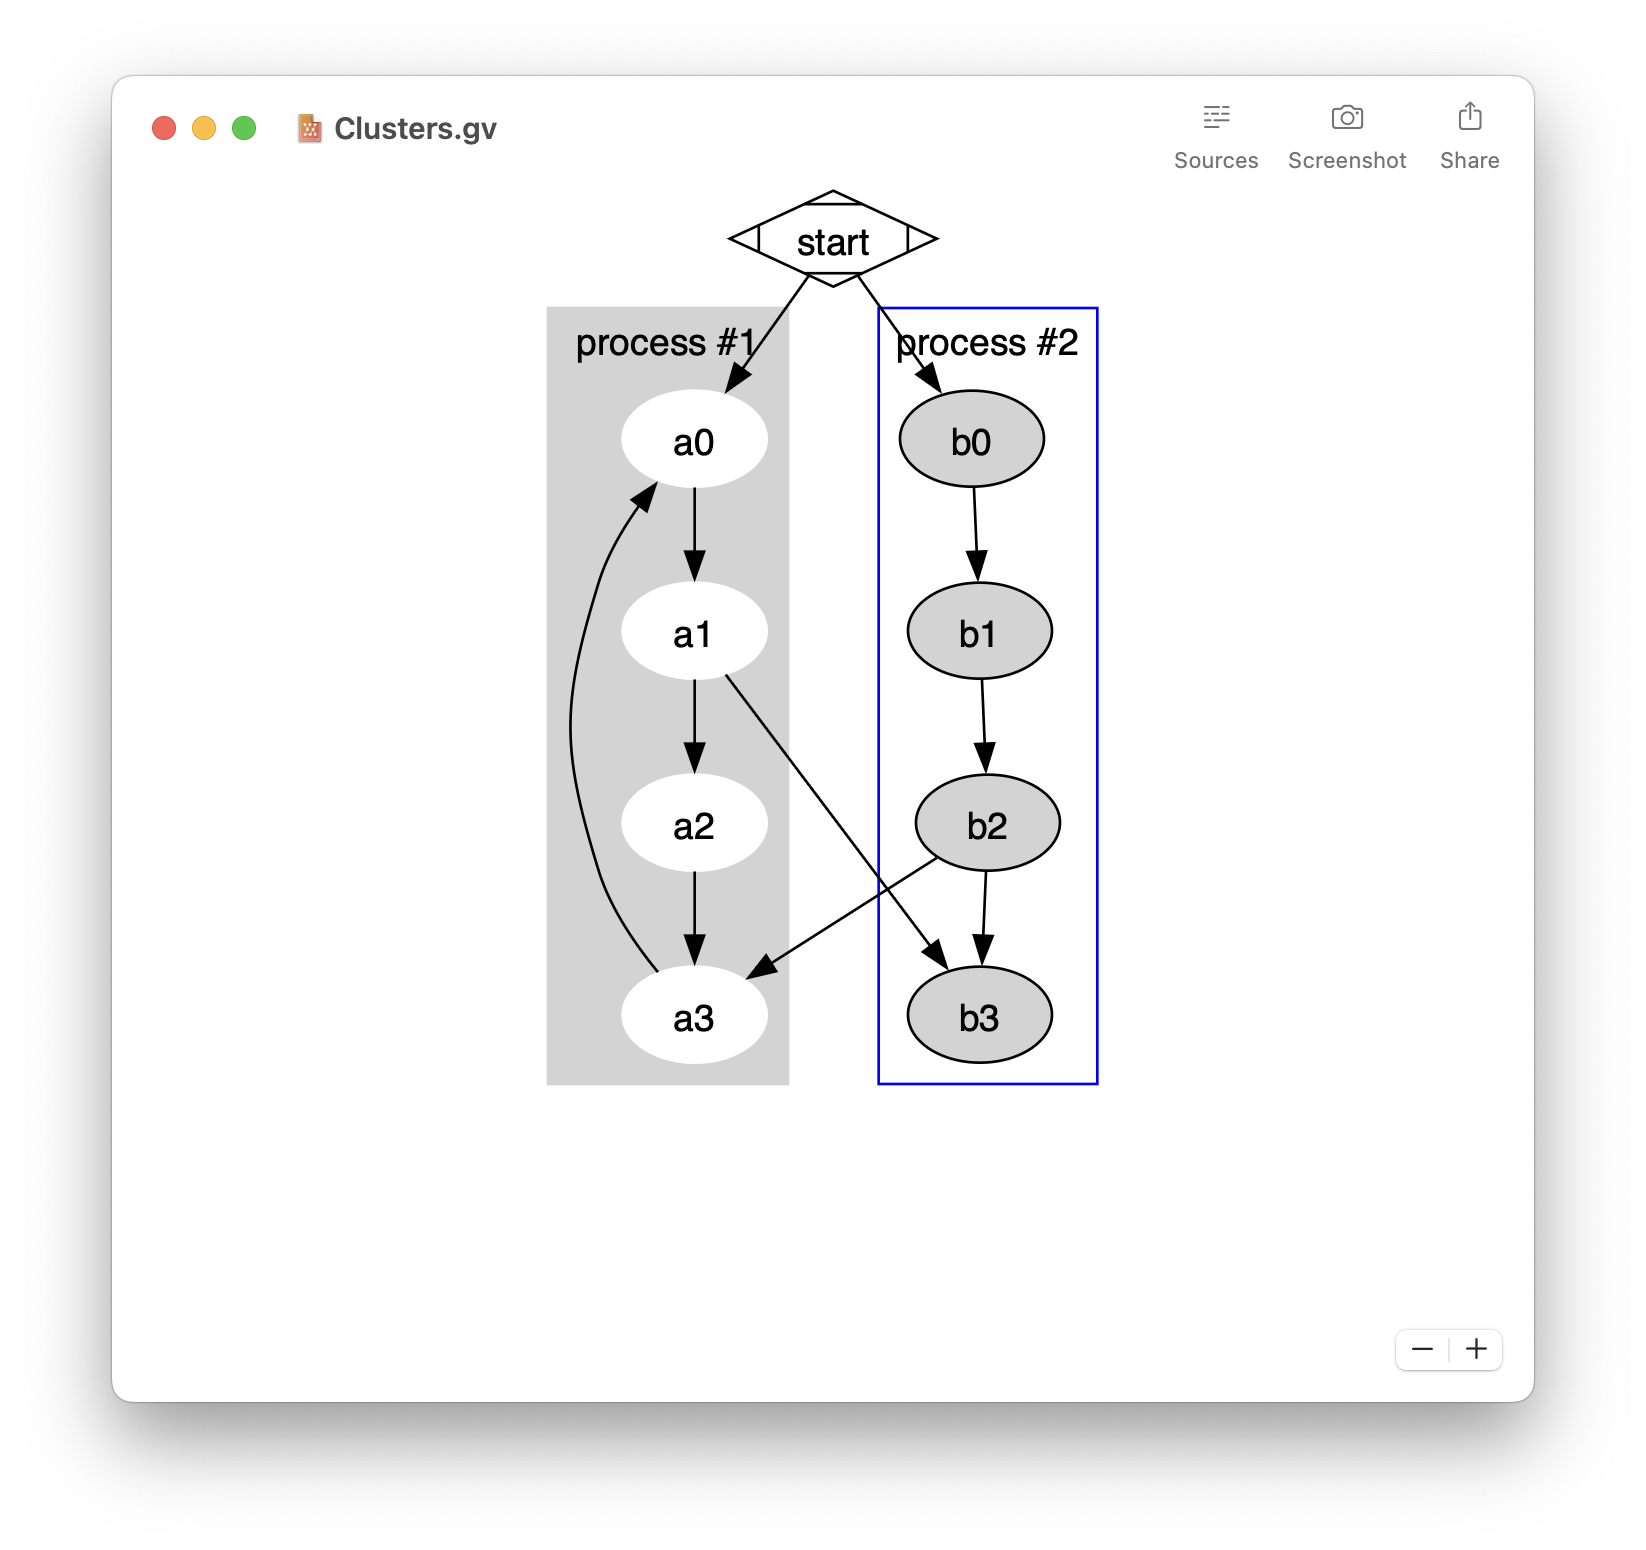
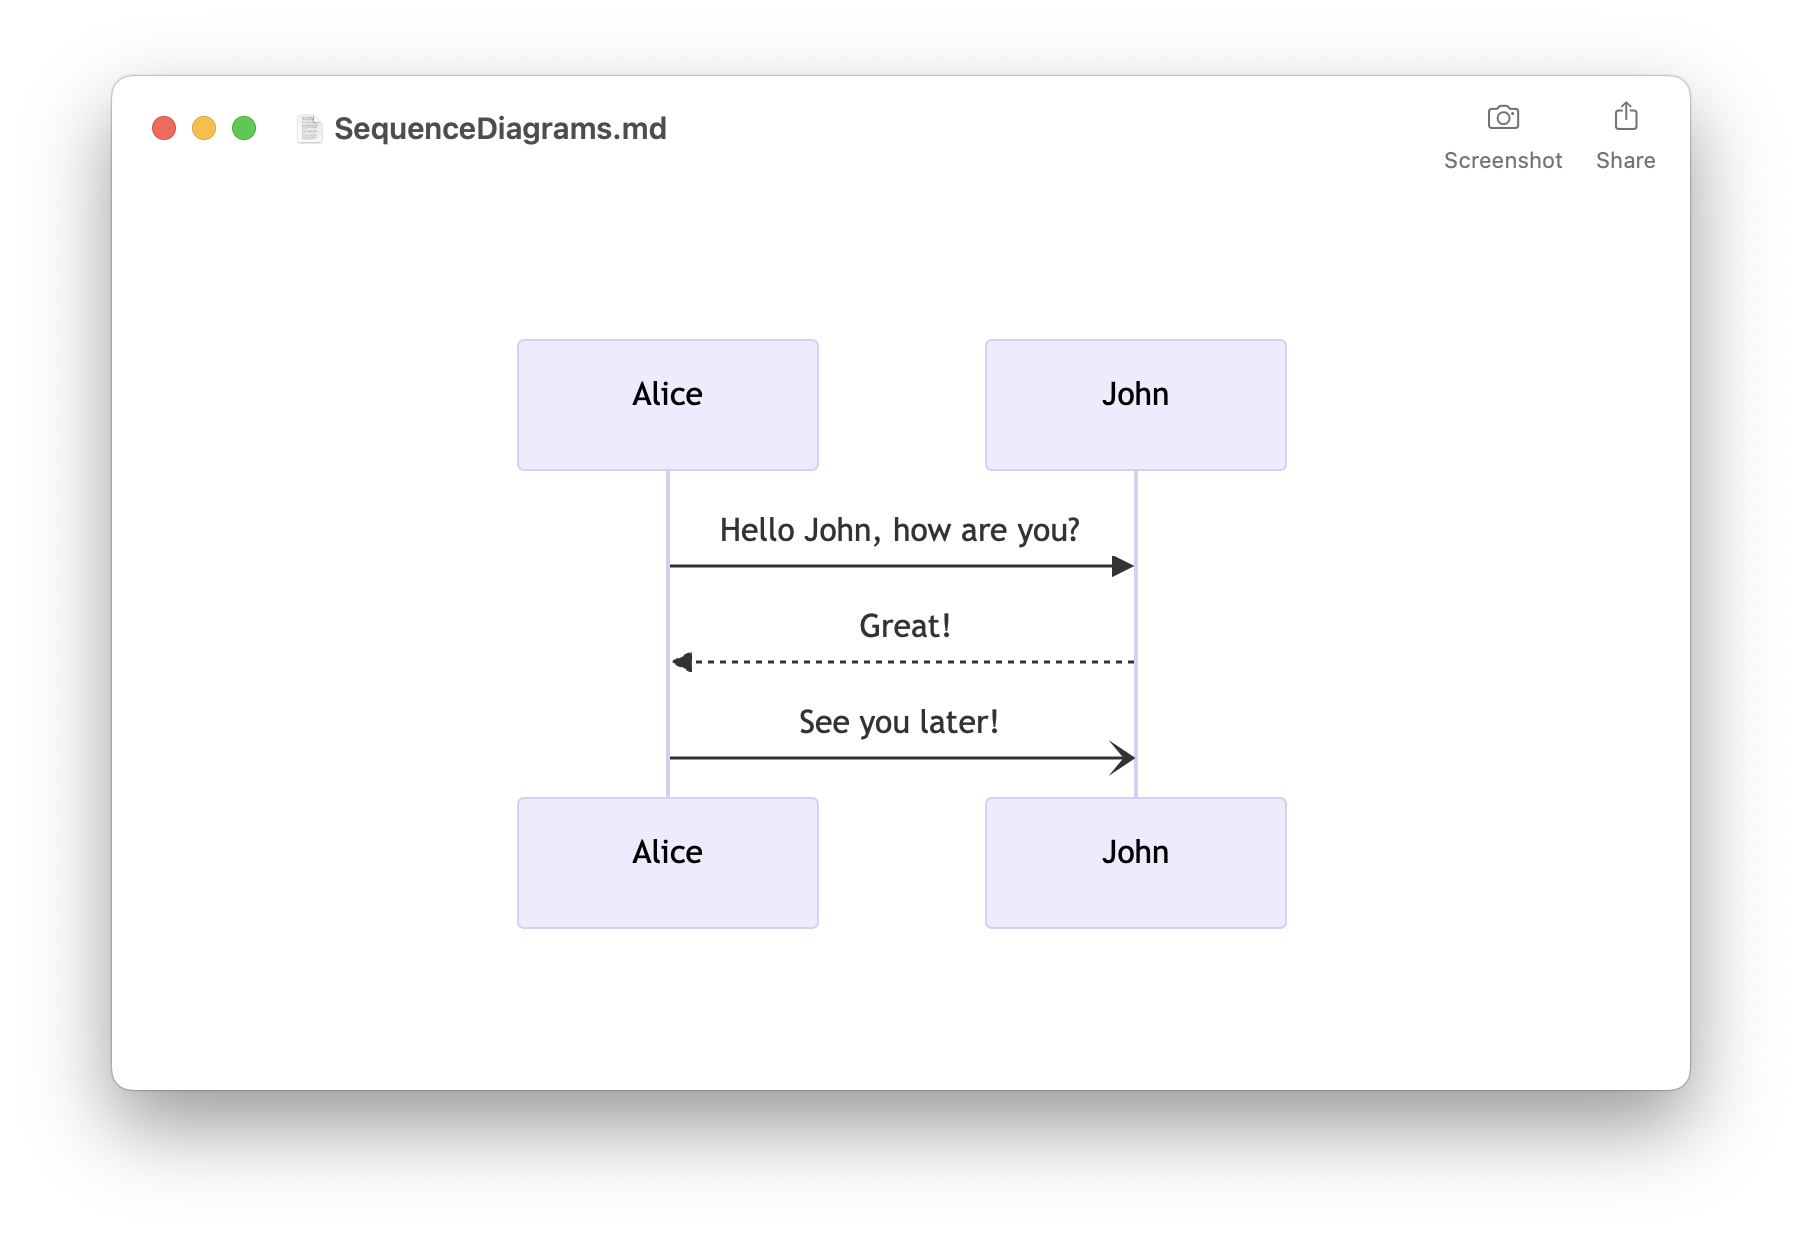
- Easily preview Mermaid diagrams
- Sequence diagrams, flowcharts, …
- Built-in editor
- Export to PDF, PNG, and SVG
- Quick Look integration
- Available on macOS, iOS, and iPadOS
- Free download on the App Store
The following BreakIntoGDB() function checks if the application runs with GDB attached. If you are running your application with the debugger attached, BreakIntoGDB calls the Debugger() function. If you are running without GDB attached, BreakIntoGDB opens a Terminal window and attaches your application to the debugger using an Applescript. In both cases, your program stops into GDB and your can examine what’s wrong.
//
//  DebuggingUtilities.h
//  BreakingIntoGDB
//
//  Created by Alexandre Colucci on 23/08/08.
//

#import <Foundation/Foundation.h>
#import <ApplicationServices/ApplicationServices.h>

#include <assert.h>
#include <stdbool.h>
#include <sys/types.h>
#include <unistd.h>
#include <sys/sysctl.h>
#include <sys/proc.h>

// From Technical Q&A QA1361
// Returns true if the current process
// is being debugged (either running
// under the debugger or has a debugger
// attached post facto).
static bool AmIBeingDebugged(void)
{
    int                 junk;
    int                 mib[4];
    struct kinfo_proc   info;
    size_t              size;

    // Initialize the flags so that,
    // if sysctl fails for some bizarre
    // reason, we get a predictable result.

    info.kp_proc.p_flag = 0;

    // Initialize mib, which tells sysctl the info
    // we want, in this case we're looking for
    // information about a specific process ID.

    mib[0] = CTL_KERN;
    mib[1] = KERN_PROC;
    mib[2] = KERN_PROC_PID;
    mib[3] = getpid();

    // Call sysctl.

    size = sizeof(info);
    junk = sysctl(mib, sizeof(mib) / sizeof(*mib), &info, &size, NULL, 0);

    assert(junk == 0);

    // We're being debugged if the P_TRACED
    // flag is set.

    return ( (info.kp_proc.p_flag & P_TRACED) != 0 );
}

static void BreakIntoGDB()
{
    if(AmIBeingDebugged())
    {
        // GDB is already attached to the application.
        // We simply break using the Debugger function.
        Debugger();
    }
    else
    {
        // GDB is not running. We open a
        // Terminal window and attach the
        // current application.

        ProcessSerialNumber psn = {0,kCurrentProcess};
        pid_t thePID;
        OSStatus err = GetProcessPID(&psn, &thePID);
        if(err == noErr)
        {
            NSString *scriptSource =
 [NSString stringWithFormat:@"tell application \"Terminal\" ndo script \"gdb attach \" & %d nend tell", thePID];

            NSAppleScript *appleScript = [[NSAppleScript alloc] initWithSource:scriptSource];
            if(appleScript != nil)
            {
                NSDictionary *errorDict;

                // Don't check the returned value
                [appleScript executeAndReturnError:&errorDict];
            }

            sleep(2);
        }
    }
}
To break into the debugger, you just have to call the BreakIntoGDB() function like in the following example.
-(IBAction)breakNow:(id)sender
{
    BreakIntoGDB();
}
Several other notes:
- The function AmIBeingDebugged() comes from the Technical Q&A QA1361.
- If you want to stop the debugger at an exact line in your code (without using the Debugger() function), you should have a look at this blog: http://cocoawithlove.com/2008/03/break-into-debugger.html
- Don’t forget that these lines should only be used in the DEBUG version of your application.