Here is a little description on how to use libMallocDebug for developers and QA people. It seems not many people know about it.

- Easily preview Mermaid diagrams
- Sequence diagrams, flowcharts, …
- Built-in editor
- Export to PDF, PNG, and SVG
- Quick Look integration
- Available on macOS, iOS, and iPadOS
- Free download on the App Store
libMallocDebug is really useful in the case you have a crash sometimes when doing something but it is hard to reproduce.
What is libMallocDebug?
libMallocDebug is a debugging malloc library that can track down memory related bugs and can be turned on and off at runtime. If you use this library, it will replace the malloc functions with a debug version of these functions. It contains several interesting options but only 3 are really useful.
MallocGuardEdges: This option adds guard pages to detect buffer overflows. Buffer overflows are not easy to find because it might crash randomly depending on what you write and where.
MallocScribble: This option detects writes to a freed block by setting its contents to 0x55 when deallocated. This can detect bugs like double frees, or using freed memory. Dereferencing a pointer in cleared freed memory will cause the program to reference the memory at 0x55555555, which usually is unallocated and will cause an immediate crash if the pointer is dereferenced for reading or writing.
MallocPreScribble: This option detects reads of uninitialized memory (also known as uninitialized variables) by setting its contents to 0xAA when allocated. Reading an uninitialized pointer from that memory will cause the program to reference the memory at 0xAAAAAAAA, which is usually unallocated and will cause an immediate crash if the pointer is dereferenced for reading or writing.
Using libMallocDebug (without sources) for beta testers:
You can run any application with the libMallocDebug library. To do that, open a terminal window (bash) and type:
export DYLD_INSERT_LIBRARIES=/usr/lib/libMallocDebug.A.dylib
export MallocGuardEdges=YES
export MallocScribble=YES
export MallocPreScribble=YES
/Applications/MyAppDBG.app/Contents/MacOS/MyAppDBG
This will run MyApp using libMallocDebug. You will see in the Terminal window some printf made by libMallocDebug. To see if libMallocDebug is used, the first line should be:
libMallocDebug[MyAppDBG-10714]: initializing libMallocDebug on thread 10b
Here is an example:
export DYLD_INSERT_LIBRARIES=/usr/lib/libMallocDebug.A.dylib
export MallocGuardEdges=YES
export MallocScribble=YES
export MallocPreScribble=YES
/Applications/MyAppDBG.app/Contents/MacOS/MyAppDBG
libMallocDebug[MyAppDBG-4388]: initializing libMallocDebug on thread 10b
task_set_exception_ports (os/kern) invalid argument
libMallocDebug[MyAppDBG-4388]: target application recently wrote to freed malloc‘d memory at:
0x32b03c0, suggesting it didn‘t realize the memory had been freed
Using libMallocDebug (with sources) for developers:
Select the Executable in the Project and add the 4 environment variables as shown on the following picture:
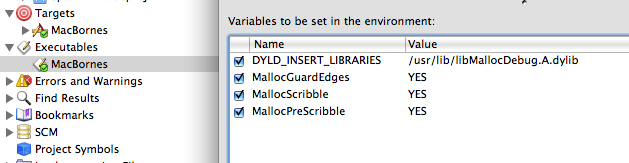
This will help to reproduce crashes. You can also use gdb and libMallocDebug at the same time.
Limitations and issues:
- This tool helps to find memory bugs but it might not find all of them.
- It checks memory at runtime and thus only detects bugs in the features you try.
- This library affects performances. So don’t use it while doing performance comparisons.
- For developers: don’t forget to uncheck the environment variables in the Executable once you are done.
- For developers: You can use gdb and libmallocDebug at the same time to reproduce and debug issues. But there is a bug on Leopard with Intel machines (rdar://5611207). You can’t use gdb in Xcode and libMallocDebug at the same time. There are several workarounds: Boot on Tiger with your intel machine, use a PowerPC machine with Leopard, or use gdb from the command line on Leopard with an intel machine.
[Update]: Thomas Clement pointed out several things.
- MallocGuardEdges, MallocScribble and MallocPreScribble are available in the default memory allocator as mentioned in Mac OS X Debugging Magic Tech Note. That means you can use them without having to use LibMallocDebug. Of course when you use LibMallocDebug I recommend you to always enable these environment variables to detect more possible issues.
- The application MallocDebug (available in the CHUD tools) uses LibMallocDebug. If you don’t like to set environment variables, you can use that application which is really nice.
- There is another allocation debugging library called libgmalloc which seems to be more aggressive than LibMallocDebug. This library can be enabled through Xcode with the menu item
Enable Guard Mallocin the menuRun. You can get more information about this library in the man page (man libgmalloc).